Google Classroom
Google Classroom
GeoGebra
GeoGebra Classroom
Sign in
Search
Google Classroom
Google Classroom
GeoGebra
GeoGebra Classroom
Outline
Handling Data
Probability
Graphs
Averages
Handling Data
Author:
HHAMaths
Table of Contents
Probability
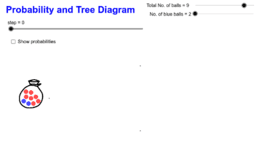
Probability and Tree Diagram
Conditional Probabilities and Independence
Experimental Probability Spinner
Copie de Probability and Tree Diagram
Graphs
Distance Time Graphs
Bar Charts and Pie Charts
Cumulative Frequency Properties
Scatter Graph
Averages
Box-and-Whisker Plot Generator
Mean Median
Next
Probability and Tree Diagram
New Resources
Cartesian vs Polar
seo tool
Hyperbolic Paraboloid
Trefoil Knot
z`]]
Discover Resources
Medians of Triangles
Spider and fly
Translate Line By Vector
Безымянный111
Interior of triangle is 180 degree
Discover Topics
Intersection
Boxplot
Integers
LCM and GCD
Rectangle