Multiple Slits
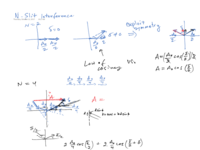
When light passes through multiple slits rather than just two, a more complicated pattern emerges. That pattern, however, is just a consequence of the very same phasor addition. The animation here should help you understand the math. The red phasor is the sum of the individual phasors. The plot is the intensity on the y-axis plotted with respect to phase angle on the x-axis. The intensity is proportional to the squared length of the red phasor sum, or as we've used many times before. The phase angle on the x-axis is the phase difference in radians between the very first phasor in the top diagram, to the very last in the chain of phasors. Notice that the large peaks of intensity are separated by radians of phase, so that for n=2 slits, it is , etc.