Google Classroom
Google Classroom
GeoGebra
GeoGebra Classroom
Abrir sesión
Buscar
Google Classroom
Google Classroom
GeoGebra
GeoGebra Classroom
Esquema
Quadratics
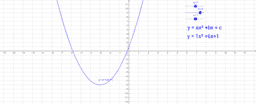
Graph y=x^2 + c
Quadratics
Autor:
Jean Maxstadt
Explore how the values of a, b, and c affect the graph.
Graph y=x^2 + c
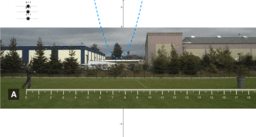
Ball in Can - Photo A
Explore how the values of a, b and c affect quadratic graph
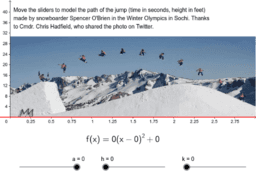
Olympic Quadratic Modeling with Sliders
Siguiente
Ball in Can - Photo A
Nuevos recursos
Angle Addition: Warm Up Exercises
רישום חופשי
Slope Between 2 Points (Phase 2)
Model sferyczny - sześcian-ośmiościan
apec
Descubrir recursos
Triangle 1st 5 Centers
Pizza theorem (Jesper Qvist) (GEOM-10)
ZADATAK21
day 109
logan
Descubre temas
Distribución de frecuencias
Números Naturales
Función Tangente
Vectores
Funciones Trigonométricas