Google Classroom
Google Classroom
GeoGebra
GeoGebra Classroom
Anmelden
Suche
Google Classroom
Google Classroom
GeoGebra
GeoGebra Classroom
Kapitel
Measure of Dispersion
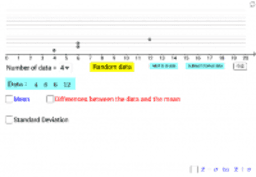
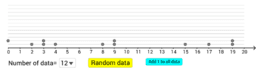
Standard Deviation (one data set) 標準差(一組數據)
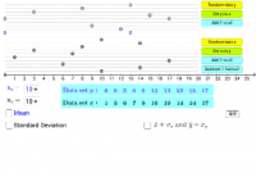
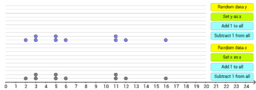
Standard Deviation (two data sets) 標準差(比較兩組數據)
Quartiles and Box Plot (one data set) 四分位數與框線圖(一組數據)
Quartiles and Box Plot (two data sets) 四分位數與框線圖(比較兩組數據)
Measure of Dispersion
Autor:
Wong Chi Hang
Standard Deviation (one data set) 標準差(一組數據)
Standard Deviation (two data sets) 標準差(比較兩組數據)
Quartiles and Box Plot (one data set) 四分位數與框線圖(一組數據)
Quartiles and Box Plot (two data sets) 四分位數與框線圖(比較兩組數據)
Weiter
Standard Deviation (one data set) 標準差(一組數據)
Neue Materialien
Angle Addition: Warm Up Exercises
seo tool
Damped Trochoidal Curve
Hyperbolic Paraboloid
Some random function
Entdecke Materialien
Area between Curves
Saddle-node Bifurcation 1
Special Parallelograms
Upper and lower sums converge
Entdecke weitere Themen
Verhältnisse
Gleichschenklige Dreiecke
Polygone und Vierecke
Mathematik
Vektoren 2D (zweidimensional)