Google Classroom
Google Classroom
GeoGebra
GeoGebra Classroom
Sign in
Search
Google Classroom
Google Classroom
GeoGebra
GeoGebra Classroom
Outline
Statistics
Box Plot
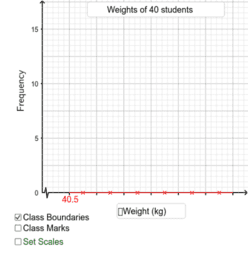
Drawing Histograms
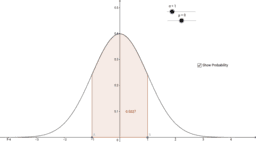
Altering the standard deviation and mean of the normal curve
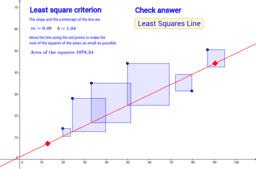
Least Squares Criterion
Statistics
Author:
Dr. Edgar
Box Plot
Drawing Histograms
Altering the standard deviation and mean of the normal curve
Least Squares Criterion
Next
Box Plot
New Resources
Nikmati Keunggulan Di Bandar Judi Terpercaya
Angle Addition: Warm Up Exercises
Trefoil Knot
Slope and Road Signs
Rose Curve
Discover Resources
Writing the Equation of a Line Graph
EulerMacros
פונקציה קווית תחומי חיוביות ושליליות
Geogebra1 Samko
Marr_Hildreth_Operator
Combination of rotation and reflection
Discover Topics
Exponential Functions
Orthocenter
Distributions
Constructions
Division