IM2.9.3 Fried Freddy's
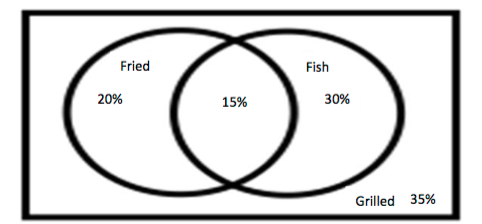
If A=Fish and B=Fried, write the following in probability notation and find the probability using the Venn diagram. The first one is completed as an example. 3. What is the probability that a randomly selected customer would order fish? Answer: P(A)=0.35 4. What is the probability that a randomly selected customer would order fried fish? 5. What is the probability that a person prefers fried chicken? 6. What is the estimated probability that a randomly selected customer would want their fish grilled? 7. If Freddy serves 100 meals at lunch on a particular day, how many orders of fish should he prepare with his famous fried recipe? 8. What is the probability that a randomly selected person would choose fish or fried? 9. What is the probability that a randomly selected person would NOT choose fish or fried?