combine graphs and equations
images of graphs
We want to combine the graphs of 4 functions with their equation. First we have to do some preparational work creating the images of the graphs. You can export the Graphics View as a picture (see the manual).
Read the article in the manual and save the picture of the four following functions on your computer:
- f(x) = x²
- f(x) = x² + 2
- f(x) = (x + 2)²
- f(x) = -x²
drop-down lists
To match the graphs with their equation we can use drop-down lists in which we can select the appropriate answer out of the options A, B, C or D and showing a blank answer as its initial position.
- Type the command list1= {"", "A", "B", "C", "D"}
- Rightclick on the list in the Algebra View to open its Properties.
- Select the tab Basic, check the option Draw as drop-down list and type graph as its Caption.
- Define ans1= SelectedIndex[list1]. When you select the option A ans will be equal to 2. At its initial position (a blank answer) ans1 will be equal to 1.
Try it yourself...
Construction Steps
| 1-12 |  | Select the Picture Tool and insert the pictures of the four graphs. Align them in the Graphics by dragging the defining corners. Hide these defining corner points afterwards. |
| 13-16 |  | Select the Text Tool and mark the graphs as A, B, C and D. |
| 17-20 | | Select the Text Tool and type the four equations of the functions. |
| 21-24 | | Define the four lists and draw them as drop-down lists behind the equations. Attention: Make sure list1 is situated behind f1 etc. |
| 25-28 | | Define the fours answers as: ans1 = SelectedIndex[list1] etc. |
| 29 |  | Select the Button Tool and create a button with Caption reset and scripting commands SetValue[list1,1] to reset all four drop-down lists to their initial blank position SetValue[list2,1] SetValue[list3,1] SetValue[list4,1] |
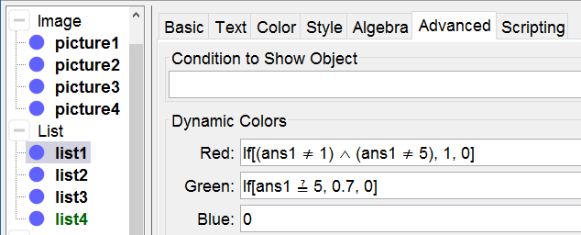
dynamic colors of the drop-down lists
Again we can use dynamic colors to control the selected answers.
- f1 = x² matches with graph D.
- The list colors red if the selection is wrong. That's if it isn't blank (ans 1) and neither D (ans 5).
- The list colors green if the selection is correct. That's if D is selected (ans = 5).
Similar exercises
Numerous exercises can be made in a similar way combining slopes, signs, equations, derivates, graphs, a list of its roots or asymptotes, axes of symmetry...