Google Classroom
Google Classroom
GeoGebra
GeoGebra Klaslokaal
Aanmelden
Zoek
Google Classroom
Google Classroom
GeoGebra
GeoGebra Klaslokaal
Overzicht
S2,3,5 Statistics
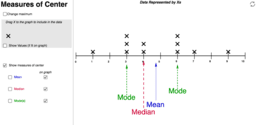
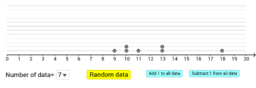
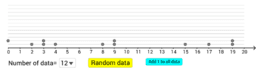
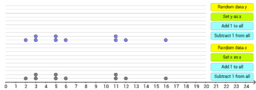
Measures of Center - Dot Plot
Measures of Central Tendency 集中趨勢的量度
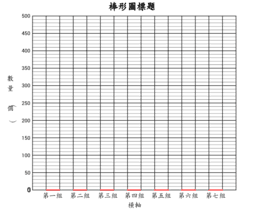
棒形圖製作器
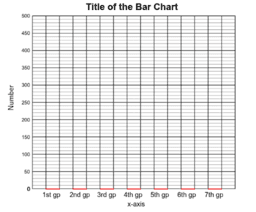
Bar Chart Plotter
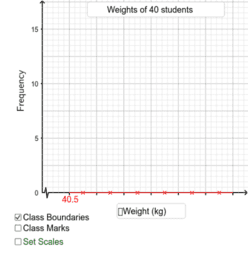
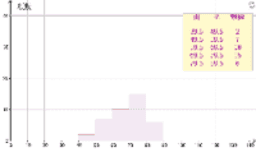
製作組織圖
Drawing Histograms
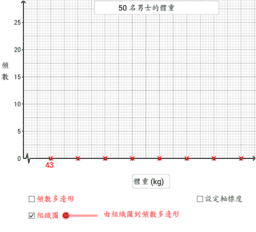
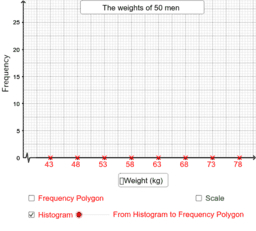
由組織圖到頻數多邊形
From Histograms to Frequency Polygons
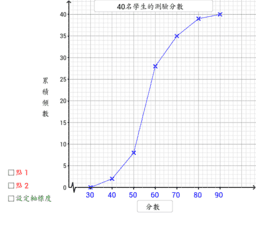
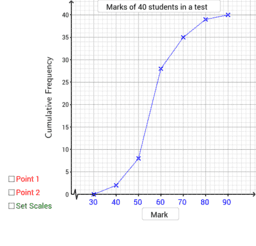
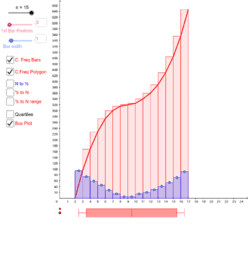
累積頻數多邊形的應用
Cumulative Frequency Polygon
累積頻數多邊形
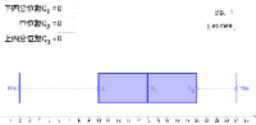
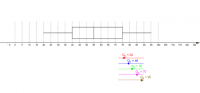
Quartiles and Box Plot (one data set) 四分位數與框線圖(一組數據)
Quartiles and Box Plot (two data sets) 四分位數與框線圖(比較兩組數據)
Quiz on Quartiles and Box Plot 四分位數與框線圖:測驗
Cumulative Frequency Properties
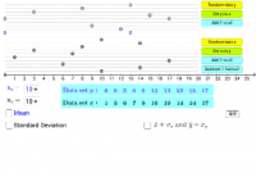
Standard Deviation (two data sets) 標準差(比較兩組數據)
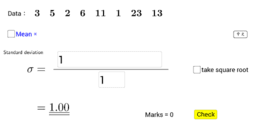
標準差:測驗
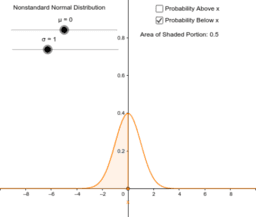
Standardizing the Normal Distribution
Box and Whisker plot
S2,3,5 Statistics
Auteur:
tkyggb
Onderwerp:
Histogram
,
Statistiek
S2 Statistics, Histogram, Frequency Polygon, Frequency Curve, Cumulative Frrequency
Measures of Center - Dot Plot
Measures of Central Tendency 集中趨勢的量度
棒形圖製作器
Bar Chart Plotter
製作組織圖
Drawing Histograms
由組織圖到頻數多邊形
From Histograms to Frequency Polygons
累積頻數多邊形的應用
Cumulative Frequency Polygon
累積頻數多邊形
Quartiles and Box Plot (one data set) 四分位數與框線圖(一組數據)
Quartiles and Box Plot (two data sets) 四分位數與框線圖(比較兩組數據)
Quiz on Quartiles and Box Plot 四分位數與框線圖:測驗
Cumulative Frequency Properties
Standard Deviation (two data sets) 標準差(比較兩組數據)
標準差:測驗
Standardizing the Normal Distribution
Box and Whisker plot
Volgende
Measures of Center - Dot Plot
Nieuw didactisch materiaal
Nested spiral octagon
美國國旗 (Claude 版)
AI 訓練教室
四邊形的特性
兩組對邊相等的四邊形
Ontdek materiaal
rectangle_tktcps
量角器
複合圖形
定积分
高中数学教材配套资源【人教】
Ontdek onderwerpen
Symmetrie
Afgeleide
Goniometrische functies
Curven schetsen
Raaklijn