Google Classroom
Google Classroom
GeoGebra
GeoGebra Classroom
Abrir sesión
Buscar
Google Classroom
Google Classroom
GeoGebra
GeoGebra Classroom
Esquema
Algebra 1
Statistics
Solving Linear Functions and Inequalities
Graphing Linear Functions
Writing Linear Functions
Algebra 1
Autor:
Thomas Gebbie
Tema:
Álgebra
Tabla de contenidos
Statistics
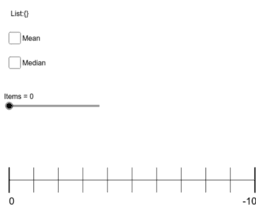
Dot Plot Generator
Box and Whisker Practice #2
Compare Box and Whisker Plots
Solving Linear Functions and Inequalities
Algebraic Proof Justification 1
Algebraic Proof Justification 2
Literal Equations Proof Justification
Graphing Linear Functions
Investigate the relationship between the three forms of line
First, use the sliders to create the parent function, y = x.
DIGI203-3D #8
Writing Linear Functions
Point Slope Form Matching
Slope Intercept Form Matching
Equivalent Linear Equations Matching
Siguiente
Dot Plot Generator
Nuevos recursos
seo tool
Fourier Lissajous (Mechanical)
Viviani's Curve
Cartesian vs Polar
Slope Between 2 Points (Phase 2)
Descubrir recursos
Complex numbers Times - what happens to modulus and argument
Reflection/11
รูปคลี่พีระมิด
Net and Surface Area of a Cylinder
Spreadsheet Shortcuts: IM Alg1.1.8
Descubre temas
Multiplicación
Ecuaciones Cuadráticas
Números Reales
Funciones
Coordenadas