Lab Exercise
Pinhole Optics
Pinhole imaging is a means of creating sharp images of objects without the use of lenses or mirrors. As the name implies, the rays of light from an object are to pass through a very small opening often the size of a pinhole, and then to a screen.
You can find plenty of information on pinhole cameras online, but making a camera is not our focus. What is interesting about pinhole optics is that even people familiar with such cameras are often unaware that the hole need not be small so long as it is relatively far from the surface onto which the image is projected. A hole several centimeters across will still make a sharp image if it's several meters from the ground.
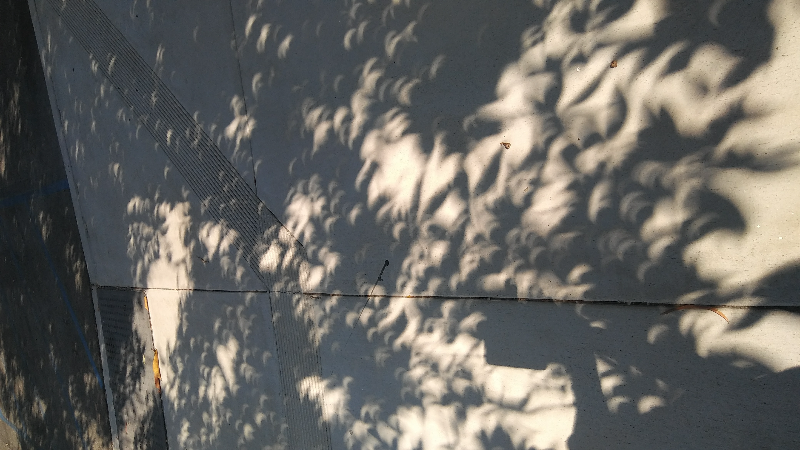
That's where sun balls come in. The sun is shaped like a sphere and has obvious edges. So it turns out that on a sunny day, there will be countless images of the sun on the pavement underneath trees. This is because the gaps between leaves are sufficiently small to act as pinholes from several meters above the ground.
In fact, partial solar eclipse are not visible to the naked eye, but you are able to see the crescent-shaped sun under nearly every tree... hundreds of images of it.
Materials
I don't want to say too much before you do this experiment because I don't want to tell you too much and ruin the learning experience, so why don't I just have you play around (experiment) and see what you get. You will need the following materials:
1. A piece of cardboard at least 30cm x 30cm, but preferably even a bit larger.
2. A tape measure or meter stick at least 2m long.
3. A ruler (also).
4. Another piece of cardboard roughly the size of notebook paper.
5. A sheet of notebook paper.
6. A partner or two.
7. A sharp knife or razorblade.
Procedure
NOTE: In all cases that follow, align both cardboard sheets such that the normal to the sheets is parallel to the sun's rays. Also, the tape measure should be held parallel to the sun's rays for all measurements.
Part 1:
1. Tape a sheet of printer paper or notebook paper on the smaller piece of cardboard. This will be your screen for the images.
2. Cut a hole in the larger cardboard sheet so that you can use it as a frame to support a sheet of notebook paper into which you will cut all the holes.
3. Make a small hole (maybe 1mm) in the paper until it's just big enough that you can see an image of the hole when holding it 1m above your screen while sunlight is passing through the hole.
4. Measure the diameter of the image made of sunlight while making sure the distance from cardboard to screen is one meter.
5. Make another hole that is 1cm across on the cardboard-supported sheet. Measure its image with the cardboard at the same location as before.
6. Make a third hole that is 3cm across and repeat.
7. Make a 4th hole around the size of a dime **but shaped like a triangle**.
8. What does its image look like?
9. What happens if you move the sheet closer to the screen?
10. Farther away?
Part 2:
It may be helpful to use tape or something to cover the holes you are not using for this part since the holes will be used one at a time.
1. Using the smallest (roughly 1mm) hole, adjust the separation distance from perforated sheet to screen to 25cm, and measure the image on the screen.
2. Repeat at 50cm.
3. Repeat at 100cm.
4. Repeat at 200cm.
5. Repeat the steps above for the other two round holes (1cm and 3cm).
Part 3:
Here you will plot your results using GeoGebra (for practice and to learn something).
1. Make a plot of your 12 data points using the distance from cardboard to screen on the x-axis and the image diameter on the y-axis.
2. If your data is good, you should have what looks like three linear data sets. Find the slope and y-intercept for each set of data from the fit equation. Please change the view to 3 significant digits (change it under options) to see the slope and intercept with sufficient accuracy.
3. Interpret the very specific meaning of the slopes and intercepts.
Questions:
1. Using your data and curve fit interpretation, how large would a sun ball be from tree leaves with roughly 4 cm gaps and a height of 7m above the ground?
2. What happened to the image of the triangle as the cardboard was raised higher and higher?
3. How does this relate to the fact that the shape between leaves doesn't really matter?
4. Could you use a short bush with big gaps between leaves in the same way (to see sun balls)?