Sign in
Search
GeoGebra
Home
Resources
Profile
Classroom
App Downloads
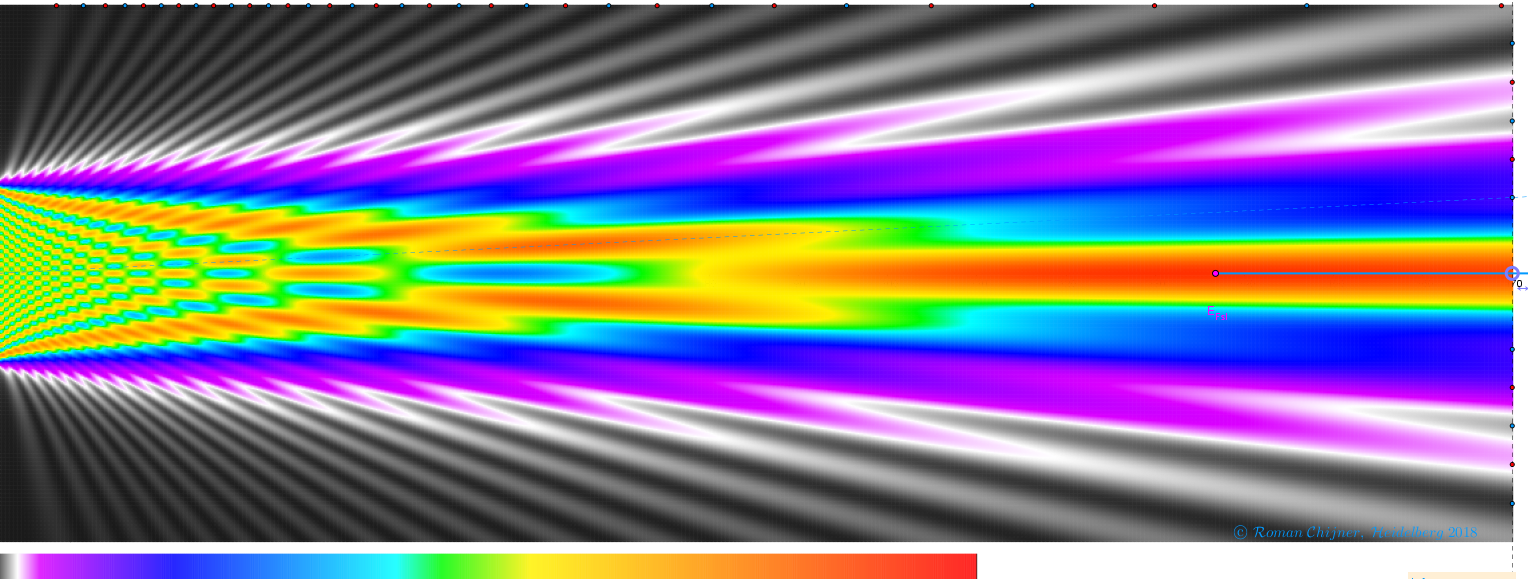
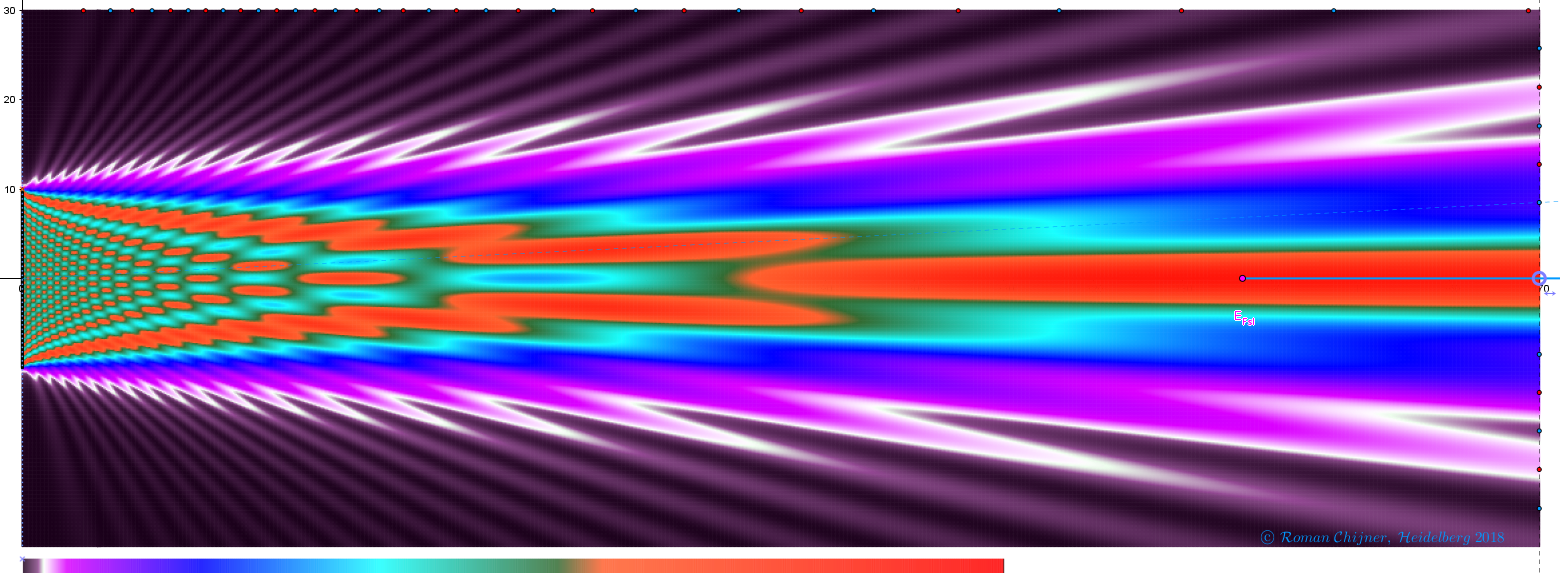
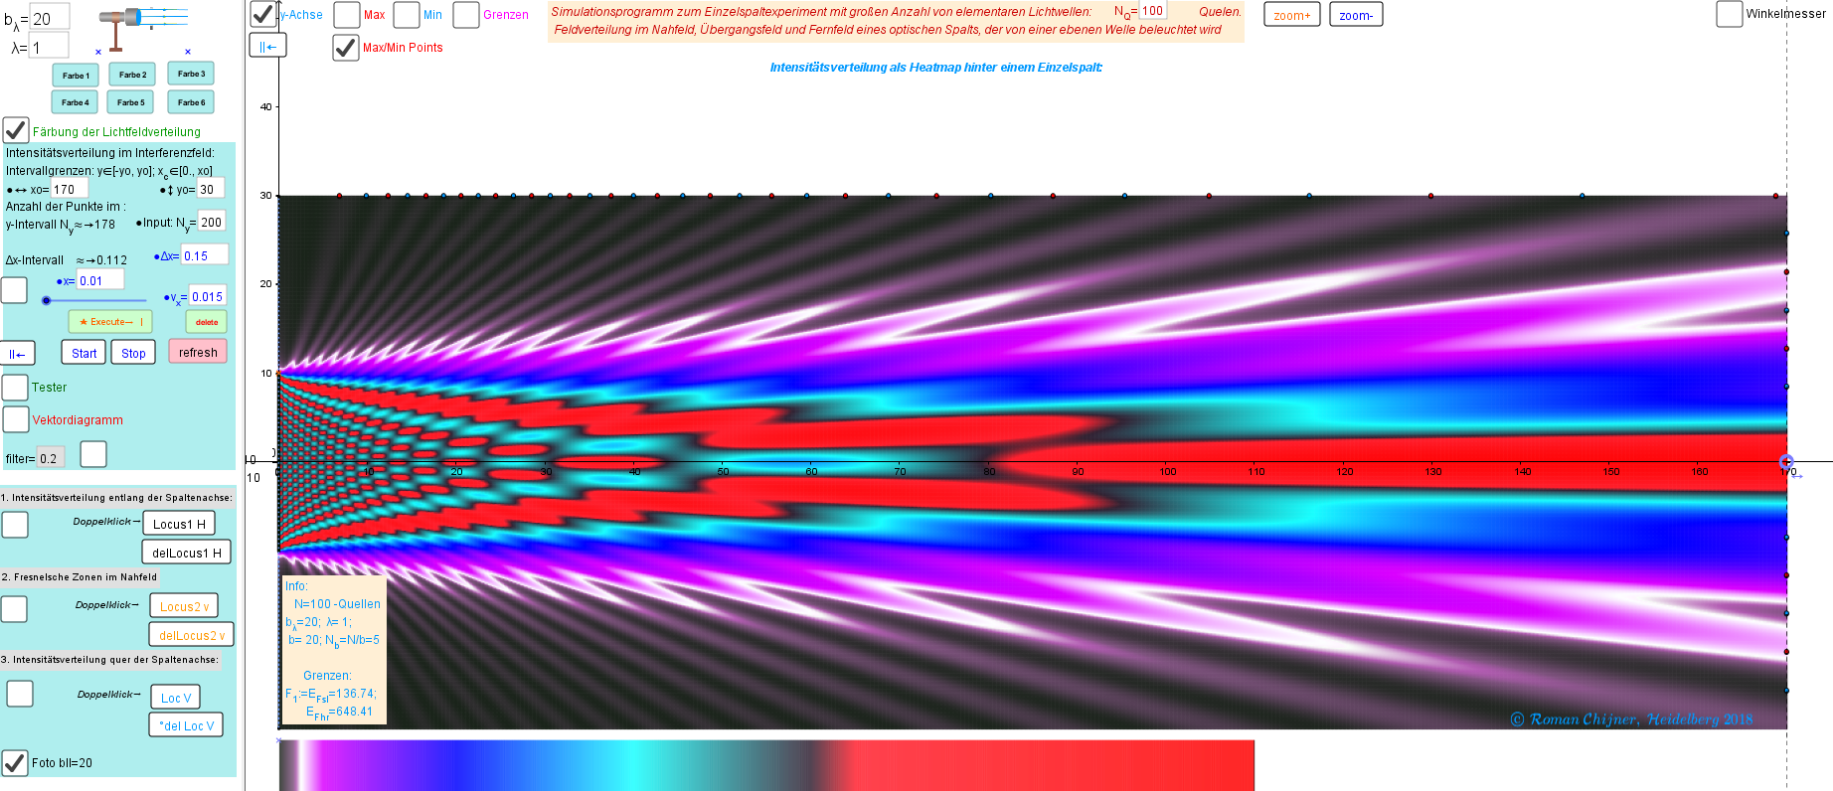
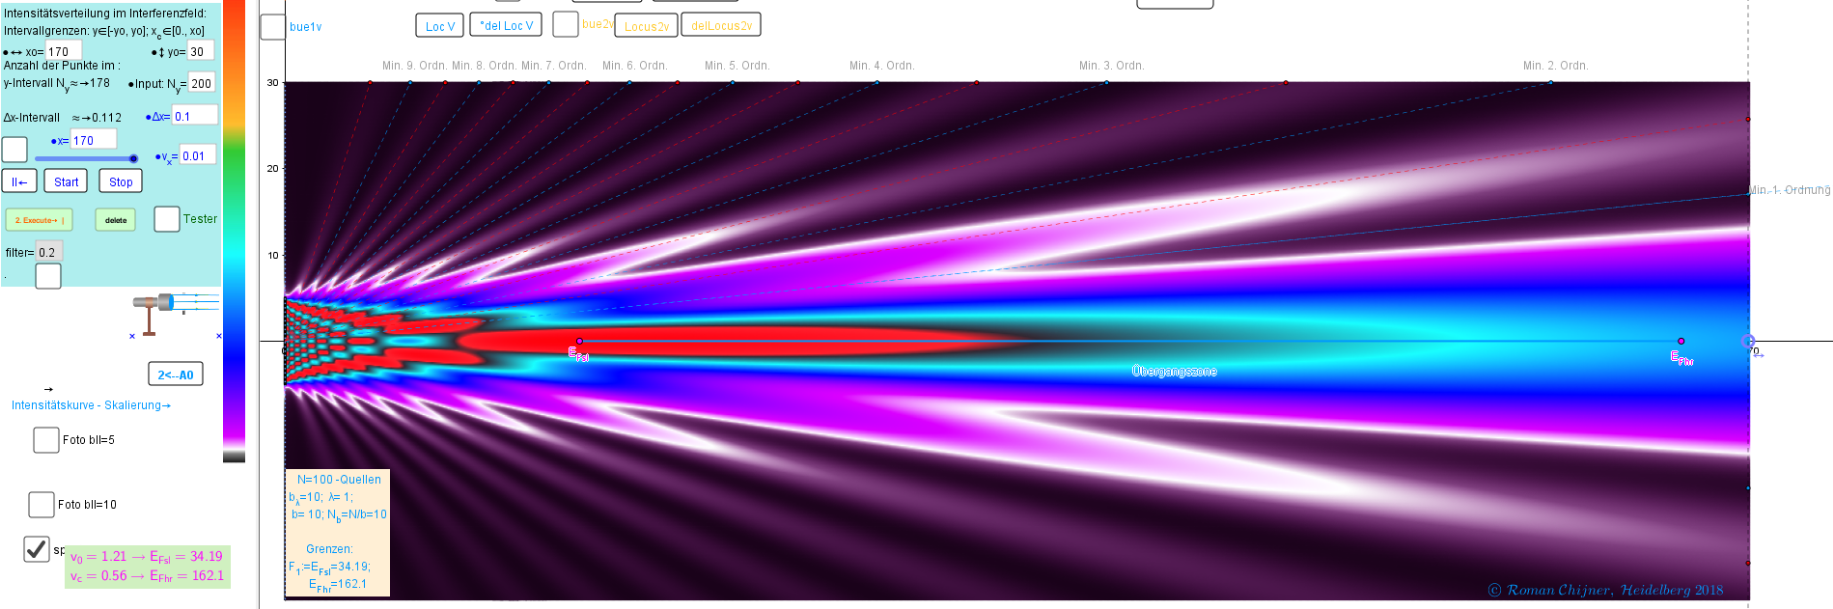
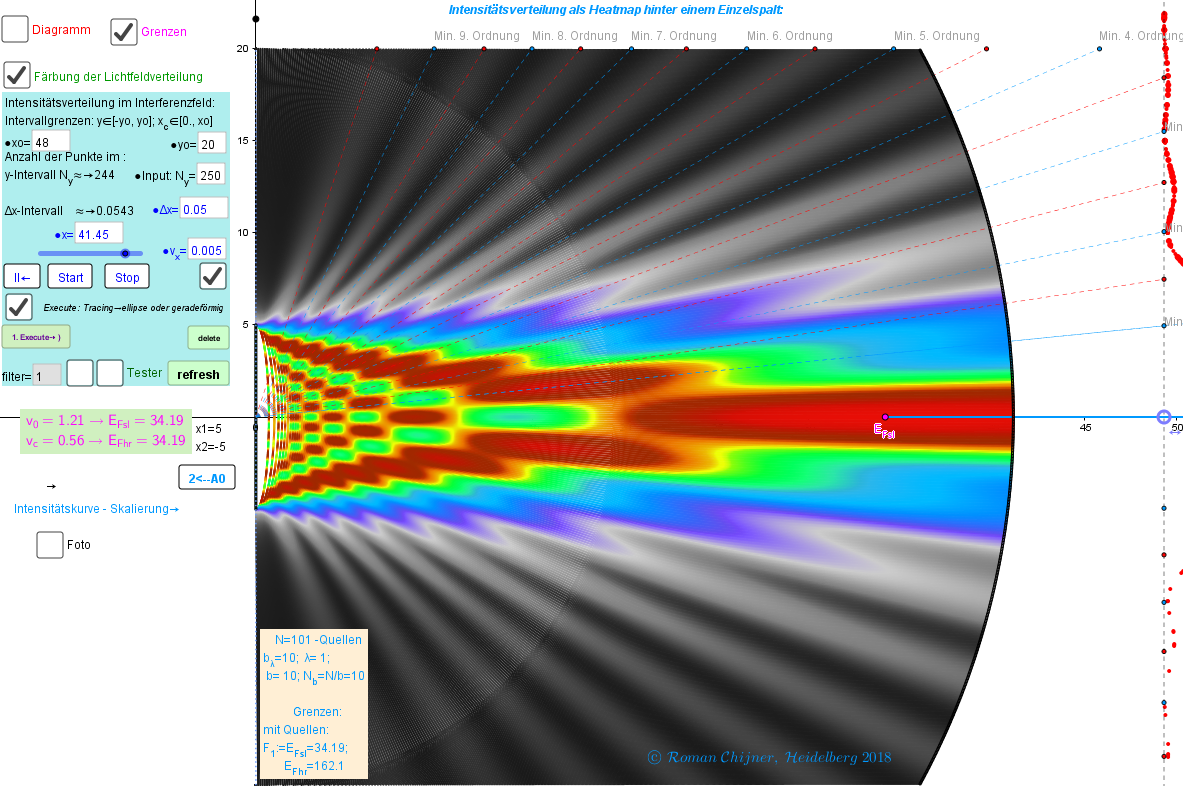
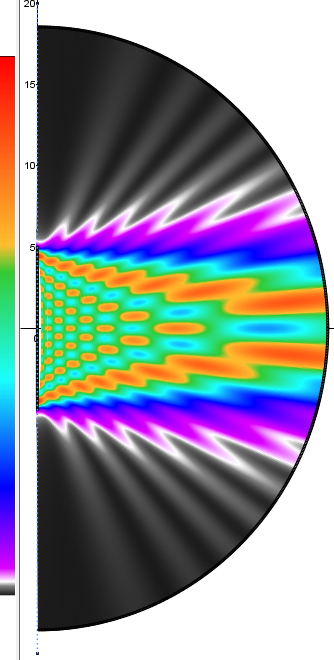
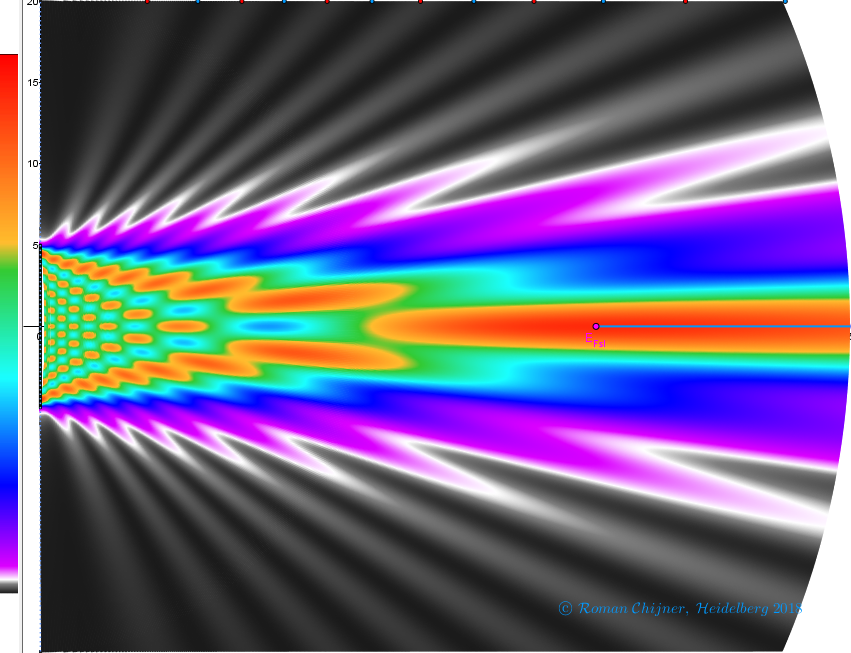
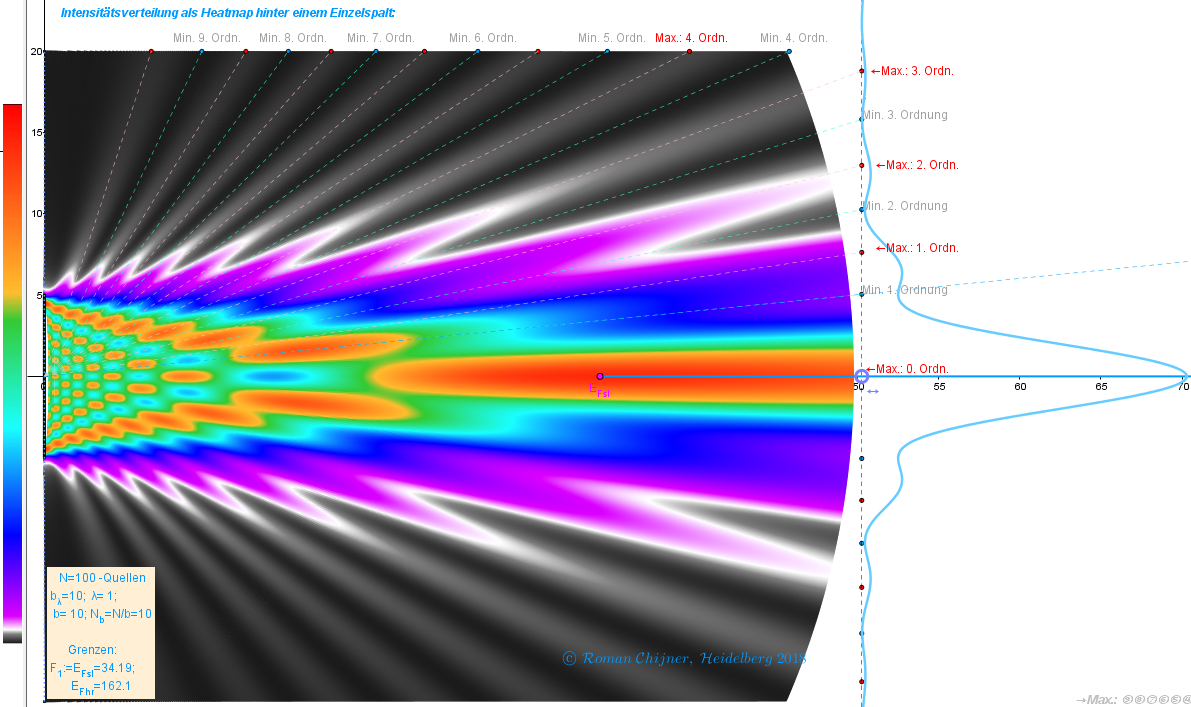
Bilder₂ zum Applet ●Heatmap hinter einem Einzelspalt, die als System von Punktquellen gedämpfter Wellen dargestellt wird.
Author:
Roman Chijner
Applet:
https://www.geogebra.org/m/dqyhaarg
b_λ=20, Farbe 6, N_Q=200
b_λ=20, Farbe 3, N_Q=200
b_λ=20, Farbe 2, N_Q=200
b_λ=10, Farbe 3, N_Q=200
b_λ=10, Farbe 1, N_Q=100
New Resources
Average Rate of Change: Graph a Function (2)
Droste effect draft
Exploring the Derivative of an Exponential Function
探究由平行線和截線所成的角
Flip Flop
Discover Resources
Introduction to the Coordinate Plane Practice
STM 511 AU1 Exterior Angles
نظرية Pascal
lamps
Disk Method Visualization
Discover Topics
Calculus
Ratios
Pyramid
Stochastic Process or Random Process
Rational Numbers