Google Classroom
GeoGebra
GeoGebra Classroom
Sign in
Search
Google Classroom
GeoGebra
GeoGebra Classroom
Outline
Estadística
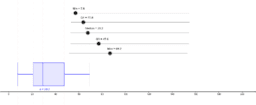
Boxplot Tool - Five Number Summary (0 to 200)
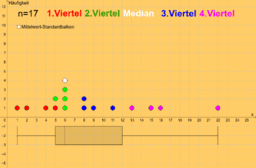
Boxplot: Datenaufteilung in Farbe
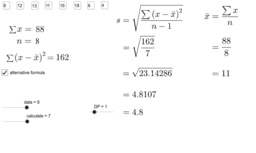
Standard Deviation Formulae
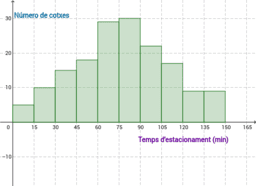
Histograma: Temps d'estacionament de cotxes en un aparcament
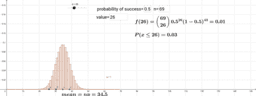
binomial distribution
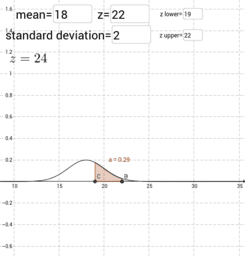
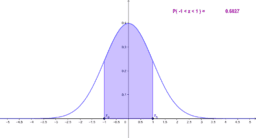
normal distribution
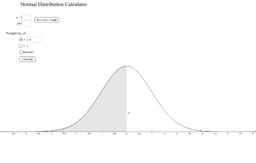
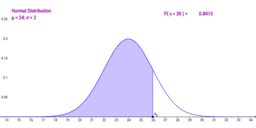
Normal Distrubution Calculator
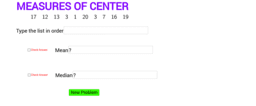
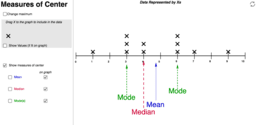
Measures of Center
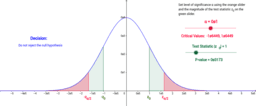
Hypothesis Test: Two-Tail, Normal Distribution
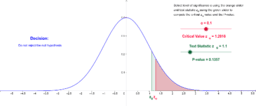
Hypothesis Test: Right Tail, Normal Distribution
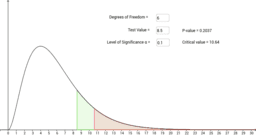
Chi Squared worksheet
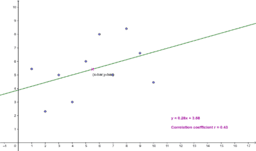
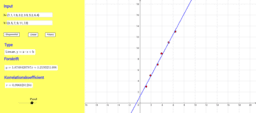
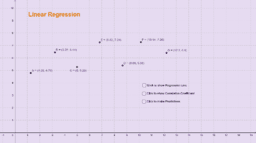
Linear Regression & Correlation Worksheet
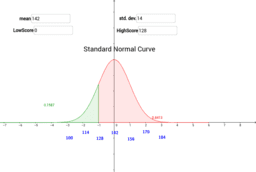
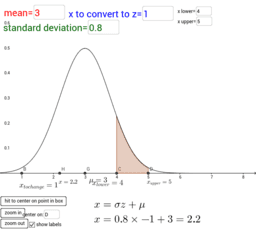
Standard Normal Distribution
Normal Distribution Worksheet (Left Tail)
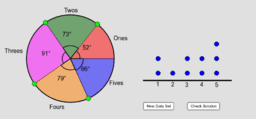
AQR Section 16: Matching a Pie Chart to a Dot Plot
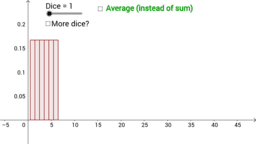
Probability distribution of dice
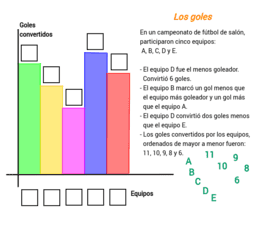
Estadística - Los goles
Chi2-test med 1 frihedsgrad
Correlation
Scatter Slider : Correlation & Line of Best Fit
Lineær regression
Normal Distribution: mean, std.dev.
Linear Regression
normal curves and much more
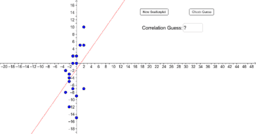
Guess the Correlation!
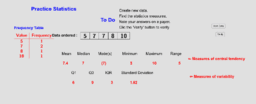
Practicing Statistical Calculation
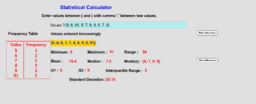
Statistical Calculator
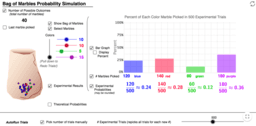
Bag of Marbles
Measures of Center - Dot Plot
Association/Correlation of Variables on a Scatterplot
Estadística
Author:
Cristina Masotta
Boxplot Tool - Five Number Summary (0 to 200)
Boxplot: Datenaufteilung in Farbe
Standard Deviation Formulae
Histograma: Temps d'estacionament de cotxes en un aparcament
binomial distribution
normal distribution
Normal Distrubution Calculator
Measures of Center
Hypothesis Test: Two-Tail, Normal Distribution
Hypothesis Test: Right Tail, Normal Distribution
Chi Squared worksheet
Linear Regression & Correlation Worksheet
Standard Normal Distribution
Normal Distribution Worksheet (Left Tail)
AQR Section 16: Matching a Pie Chart to a Dot Plot
Probability distribution of dice
Estadística - Los goles
Chi2-test med 1 frihedsgrad
Correlation
Scatter Slider : Correlation & Line of Best Fit
Lineær regression
Normal Distribution: mean, std.dev.
Linear Regression
normal curves and much more
Guess the Correlation!
Practicing Statistical Calculation
Statistical Calculator
Bag of Marbles
Measures of Center - Dot Plot
Association/Correlation of Variables on a Scatterplot
Next
Boxplot Tool - Five Number Summary (0 to 200)
New Resources
Poorly Drawn Parallelograms 3
Parallelograms: Quick Investigation
alg2_05_05_01_slider_practice_flvs
Shadow of a Cube (v2)
Tutorial: Create lists of numbers and objects
Discover Resources
Seperable Differential Equations Whiteboardstart
OmtrekshoekMiddelpuntshoek Bewijs 1-3 Op lijn
Parallelogram Properties - Part 3
Area of triangle - height outside rectangle
Graphing Inequalities
Discover Topics
Natural Numbers
Tangent Function
Distributions
LCM and GCD
Isosceles Triangles