Google Classroom
GeoGebra
GeoGebra Classroom
Sign in
Search
Google Classroom
GeoGebra
GeoGebra Classroom
Outline
GRAPH OF LOGARITHM
Lesson Plan
Lesson Evaluation
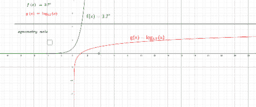
Practice 1: Exploring the Relationship Between Exponential Function and Logarithmic Function
Practice 2: Investigate Logarithmic Function According to Parameters
GRAPH OF LOGARITHM
Author:
Math Teachers' Adventure of ICT Integration
,
BAYAL ÖĞRENCİ ÇALIŞMA GRUBU
Topic:
Logarithm
Lesson Plan
Lesson Evaluation
Practice 1: Exploring the Relationship Between Exponential Function and Logarithmic Function
Practice 2: Investigate Logarithmic Function According to Parameters
Next
Lesson Plan
New Resources
Average Rate of Change: Graph a Function (1)
alg2_05_05_01_applet_exp_flvs
Poorly Drawn Parallelograms 3
Poorly Drawn Parallelograms 2
Quiz: Finding Average Rate of Change
Discover Resources
'infini
Enlargement
Familia 2
hinh chu nhat
Project_0102
Discover Topics
Mode
Pythagoras or Pythagorean Theorem
Tree Diagrams
Addition
Cosine