Google Classroom
GeoGebra
GeoGebra Classroom
Sign in
Search
Google Classroom
GeoGebra
GeoGebra Classroom
Outline
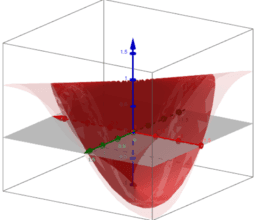
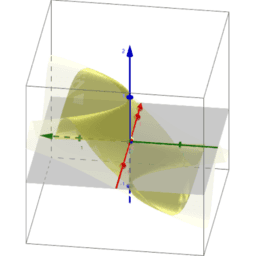
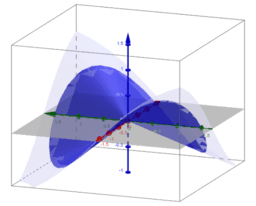
Visualization of limits of functions of two variables
Introduction
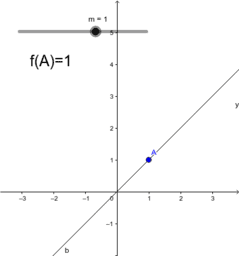
Example 1
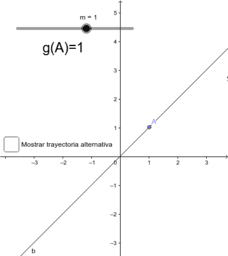
Example 2
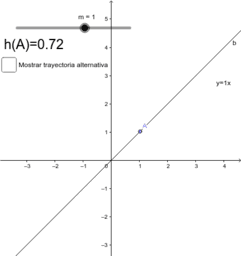
Example 3
Polar coordinates: Example 1
Polar coordinates: Example 2
Polar coordinates: Example 3
Thank you very much
Visualization of limits of functions of two variables
Author:
Laura del Río
Topic:
Functions
,
Limits
Presentation for sharing at the GeoGebra Global Gathering 2017
Introduction
Example 1
Example 2
Example 3
Polar coordinates: Example 1
Polar coordinates: Example 2
Polar coordinates: Example 3
Thank you very much
Next
Introduction
New Resources
The Derivative
רישום חופשי
Graph that Function (v3)
Graph that Function
Untitled
Discover Resources
Mystery Functions Part 1
SAS Congruence
Quadric surfaces
წრფე
AREA POLIGONI REGOLARI
Discover Topics
Cuboid
Inequalities
Median Line
Square
Reflection