Google Classroom
GeoGebra
GeoGebra Classroom
Sign in
Search
Google Classroom
GeoGebra
GeoGebra Classroom
Outline
Handling Data
Probability
Graphs
Averages
Handling Data
Author:
HHAMaths
Table of Contents
Probability
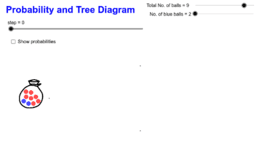
Probability and Tree Diagram
Conditional Probabilities and Independence
Experimental Probability Spinner
Copie de Probability and Tree Diagram
Graphs
Distance Time Graphs
Bar Charts and Pie Charts
Cumulative Frequency Properties
Scatter Graph
Averages
Box-and-Whisker Plot Generator
Mean Median
Next
Probability and Tree Diagram
New Resources
Average Rate of Change: Graph a Function (2)
alg2_05_05_04_applet_exp_fxn_flvs
Poorly Drawn Parallelograms 2
Finding Average Rate of Change of a Function
Variation Theory Parallelogram Proofs
Discover Resources
Tessellation from Triangle (Step 5)
Triangle Bisector 1
NA - 3 Angles in segment
exercises with GGscript
พื้นผิวในปริภูมิ3มิติ
Discover Topics
Pie Chart or Circle Chart
Frequency Distribution
Polynomial Functions
Pyramid
Stochastic Process or Random Process